VS Code
When working with an ASP.NET Core + SPA (in this case Angular) application, debugging might be quite difficult in VS Code. There is however a way to set it up.
1. Download Debugger For Chrome and C# Extension
Debugger for Chrome is a great plugin that allows for JavaScript debugging in Chrome. C# is also necessary to download.
2. Add a New Configuration
We need to add a custom configuration to make it run.
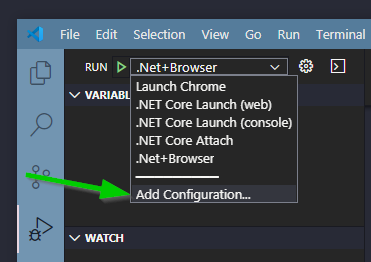
This will allow you to edit launch.json.
3. Add Compounds
We will add a compound that will run two configurations simoutanuesly.
// ...
"compounds": [
    {
        "name": ".Net+Browser",
        "configurations": [".NET Core Launch (console)", "Launch Chrome"]
    }
],
//...
We need to create the two configurations that will run.
4. Create Configurations
We need to add the configurations for .NET Core Launch (console) and Launch Chrome.
/...,
"configurations": [
    {
        "type": "chrome",
        "request": "launch",
        "name": "Launch Chrome",
        "url": "http://localhost:5000",
        "webRoot": "${workspaceRoot}/ClientApp"
    },
    {
        "name": ".NET Core Launch (console)",
        "type": "coreclr",
        "request": "launch",
        "preLaunchTask": "build",
        "program": "${workspaceFolder}/bin/Debug/netcoreapp3.1/path.to.project.dll",
        "args": [],
        "cwd": "${workspaceRoot}",
        "stopAtEntry": false,
        "console": "internalConsole"
    },
//...
Notice that your paths may not be the same as my paths, be sure that program, webRoot and cwd points to the right places.
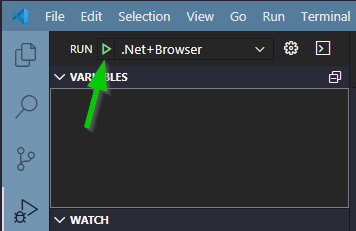
5. Run Debugging
Now simply start debugging with the following button.
EXTRA: Save Chrome Configurations
If you want to save your data and extensions between is debugging session, add the following line to the Launch Chrome configuration.
"userDataDir": "${workspaceRoot}/.vscode/chrome"